I perioden 13. - 26. Februar 2024 ble gytefeltene til norsk vårgytende sild fra Møre (62º15ˊN) til Tromsøflaket (71º'N) dekket akustisk med de kommersielle fiskefartøyene MS Eros og MS Vendla. Den estimerte biomassen var omtrent 15 % lavere, og det estimerte antallet omtrent 5 % høyere sammenlignet med fjorårets tokt. Usikkerheten i årets estimater er vesentlig lavere enn i fjor. Den målte delen av bestanden var dominert av 2016-årsklassen med 50 % i antall og 57 % i vekt. Mesteparten av gytebestanden befant seg vest av Lofoten og Vesterålen i år, mer nordlig fordelt enn tidligere år. Det ble observert mer ung sild i nord enn vanlig på dette toktet, noe som er et positivt tegn når det gjelder framtidig rekruttering til gytebestanden. Det anbefales å bruke estimatene av antall per alder fra toktet i 2024 i ICES sin bestandsvurdering av norsk vårgytende sild.
Distribution and abundance of Norwegian spring-spawning herring during the spawning season in 2024
Rapportserie:
Toktrapport 2024-8
ISSN: 1503-6294
Publisert: 04.04.2024
Prosjektnr: 15706
Forskningsgruppe(r):
Pelagisk fisk
Tema:
Norsk vårgytende sild
Program:
Norskehavet
Forskningsgruppeleder(e):
Espen Johnsen (Pelagisk fisk)
Godkjent av:
Forskningsdirektør(er):
Geir Huse
Programleder(e):
Bjørn Erik Axelsen
English summary
Sammendrag
During the period 13-26th of February 2023 the spawning grounds of Norwegian spring-spawning herring from Møre (62º15 ˊ N) to Tromsøflaket (71 º N) were covered acoustically by the commercial fishing vessels MS Eros and MS Vendla. The estimated biomass was about 15 % lower, and the estimated total number was about 5 % higher this year compared to last year’s survey. The uncertainty of the estimates in 2024 was much lower than last year. The surveyed population was dominated by the 2016 year class; 50 % in numbers and 57 % in biomass. Most of the spawning stock was found west of Lofoten and Vesterålen this year, more northerly distributed than in earlier years. More young herring was observed in the north than normal on this survey which is a positive sign in terms of future recruitment to the spawning stock. The estimates of abundance by age group from the survey in 2024 are recommended to be used in this year’s ICES stock assessment of Norwegian spring-spawning herring.
1 - Introduction
Acoustic trawl surveys on Norwegian spring-spawning herring (NSSH) during the spawning season has been carried out since 1988, with some breaks (in 1992-1993, 1997, 2001-2004 and 2009-2014). In 2015, the survey time series was initiated again partly based on the feedback from fishermen and fishermen’s organizations that Institute of Marine Research (IMR) should conduct more surveys on this commercially important stock. From 2015, the NSSH spawning survey has been carried out using hired commercial fishing vessels. In the ICES benchmark assessment of NSS herring in 2016 (ICES 2016) it was decided to use the data from this survey time series as input to the stock assessment, together with the international ecosystem survey in the Norwegian Sea in May and catch data. Thus, the results from the NSSH spawning survey have significant influence on the ICES catch advice on NSSH.
The main objective of the NSSH spawning survey 2024 was to estimate the abundance by age group (both mean and sampling uncertainty), for use in the ICES WGWIDE stock assessment. Moreover, other biological information about the spawning stock of NSS herring is estimated: spatial distribution of biomass and acoustic densities, total biomass and stock numbers with sampling uncertainty, spatial patterns in maturity and variations in temperature.
2 - Material and methods
2.1 - Survey design
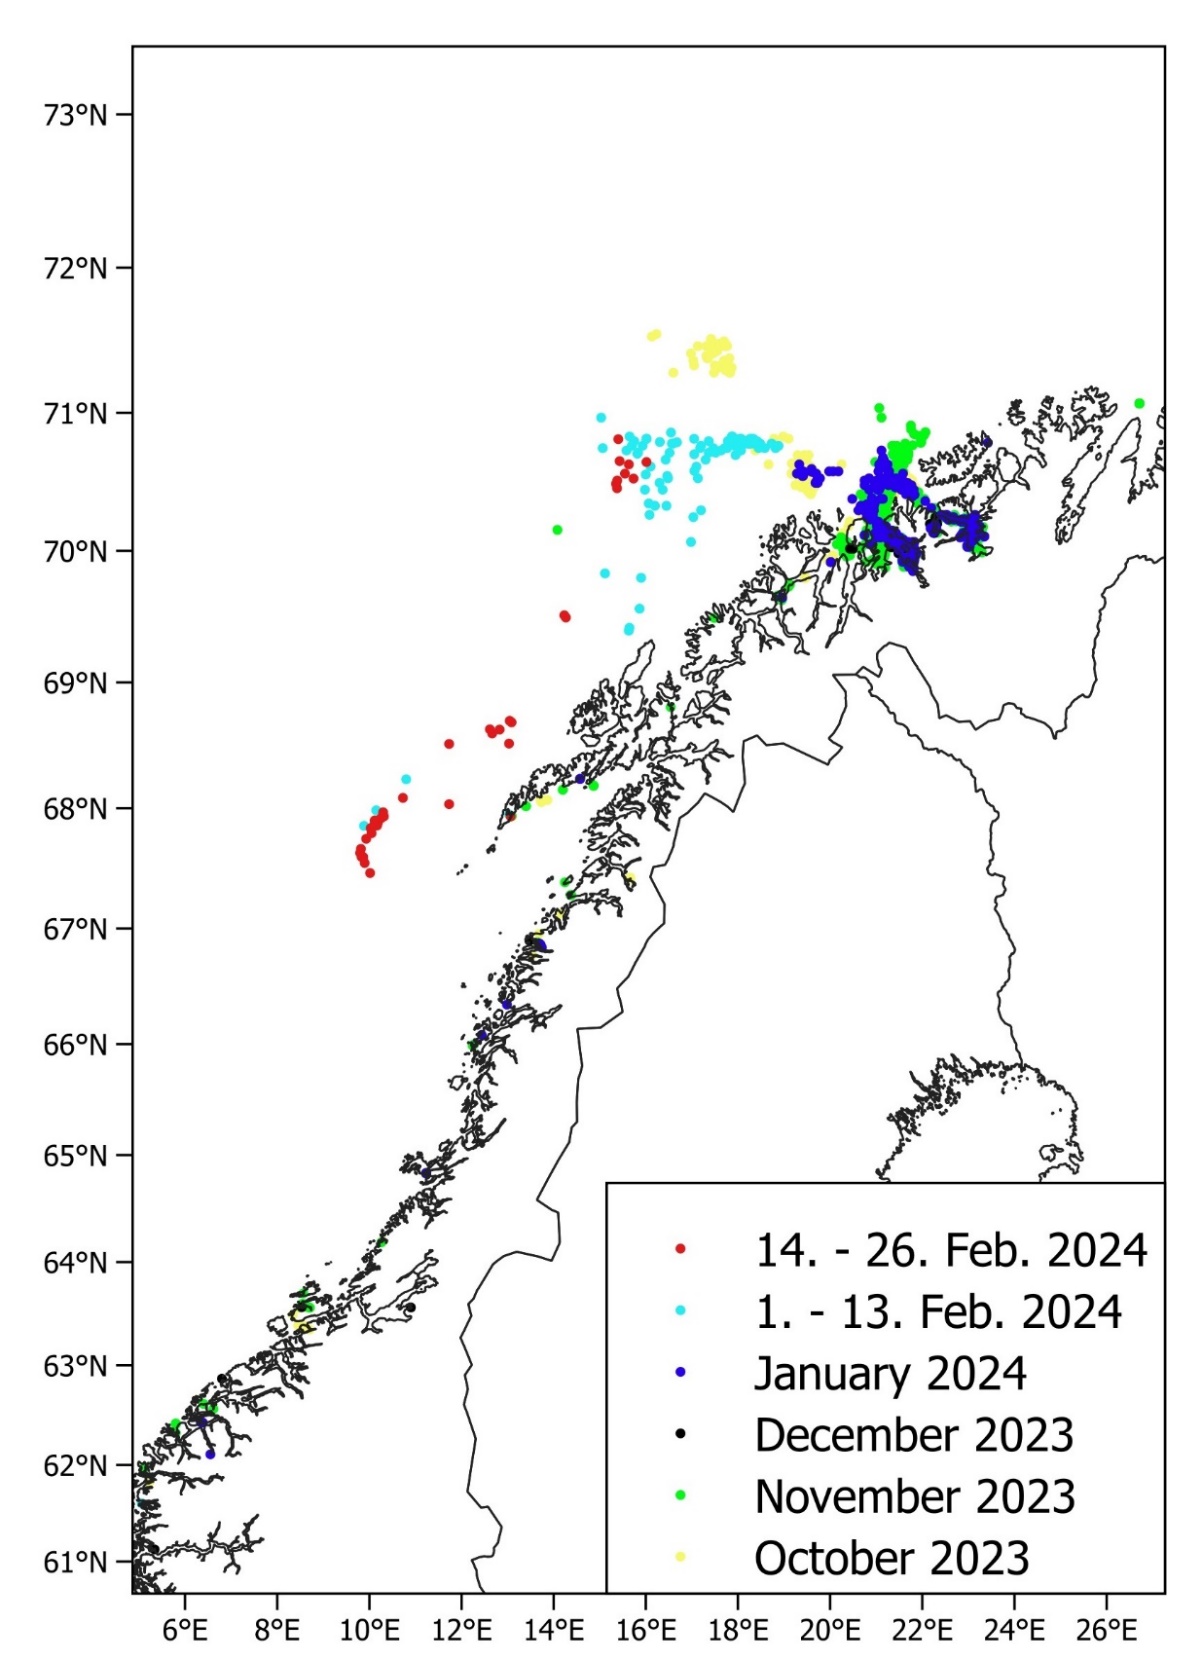
During the period 13-26th of February 2024 (same period as in 2017-2023) the continental shelf along the Norwegian coast from Møre (62º15ˊN) to Tromsøflaket (71ºN) were covered by the commercial fishing vessels MS Eros and MS Vendla. The survey was planned based on information from the previous spawning cruises and the distribution of the herring fishery during the autumn 2023 up to the survey start February 13th 2024 (Figure 1). The Norwegian fishery in the winter season 2023/2024 mainly occurred in and around the wintering area in the Kvænangen and Alta fjord areas. Prior to the survey in the first half of February 2024 the fishery indicated that the herring were entering the spawning grounds from the wintering areas north of Tromsø, and no herring catches had been taken south of Røst (67º30ˊN, 12ºE) or in oceanic areas in the Norwegian Sea west of Røst when the survey started. A northerly distribution of the spawning stock like last year was therefore expected. The survey coverage was therefore planned to take account of a large flux of herring entering the survey area from the north. The survey design followed a standard stratified design (Jolly and Hampton 1990), where the survey area was stratified before the survey start according to the assumed density structures of herring during the spawning migration (based on previous surveys and fisheries). All strata were covered with a zigzag design since this is the most efficient use of survey effort (Harbitz 2019). The survey planner function in the Rstox_1.11 package in r was used to generate the transects, and this function generates survey tracks with uniform coverage of strata and a random starting position in the start of each stratum. Each straight line in the zigzag track within a stratum was considered as a transect and a primary sampling unit (Simmonds and MacLennan 2005). Transit tracks between strata, i.e. from the end of the zigzag in one stratum to the start of the zigzag in the next stratum, were not used as primary sampling units. Prior to the start of the survey in 2024 all reported NSSH catches had been taken north of 66°N, hence, the degree of coverage (distance of acoustic transects divided by the square root of the stratum area, see Aglen 1989) was planned to be low to moderate south of 66°N since it was assumed that the fishing fleet followed the front of the herring migrating south and that the abundance of herring south of the fleet therefore was insignificant.
2.2 - Data sampling
Acoustic recording was done with 38 kHz Simrad EK80 echo sounders. The software LSSS version 2.15.0 was used for post-processing (Korneliussen et al. 2016). Echogram scrutinization was carried out by the cruise leader and the chief instrument officer, and based on the acoustic backscatter signal and trawl samples the backscatter were categorized into one of the following categories: “herring”, “other”, ”capelin” or “air bubbles” (upper 20 meters from the transducer near field). The acoustic density values were stored by acoustic category in nautical area scattering coefficient (NASC) [m2 n.mi.-2] units (MacLennan et al. 2002) in a database with a horizontal resolution of 0.1 nmi and a vertical resolution of 10 m, referenced to the sea surface.
Trawl sampling was planned to be carried out on a regular basis during the survey to confirm the acoustic observations and to be able to give estimates of abundance for different size and age groups. Both vessels used a Multpelt 832 scientific sampling trawl with small meshed (20 mm) inner net in the codend and a slit (so called “splitt”) close to the codend to avoid too large catches. The following variables of individual herring were recorded from each station with herring catch: total weight in grams and total length in cm (rounded down to the nearest 0.5 cm) of up to 100 individuals per haul. In addition, age from scales, sex, maturity stage, stomach fullness and gonad weight in grams were measured in up to 50 individuals per haul. Genetic samples and otoliths were also collected from these individuals.
CTD casts (using Seabird 911 systems) were taken by both vessels, spread out haphazardly in the survey area.
2.3 - Abundance estimation
The survey estimates are calculated using Stox 3.6.2 (Johnsen et al. 2019), where the sampling means and sampling uncertainties are derived from 1000 bootstrap runs. More details and equations from the estimation process can be found in Salthaug et al. (2021). In StoX, all trawl stations with herring were used to derive a common length distribution for all transect within the respective strata and all stations had equal weight. The following acoustic target strength (TS)-to-fish length (L in cm) relationship was used for herring: TS = 20logL – 71.9 (Foote 1987).
3 - Results and discussion
3.1 - Survey coverage
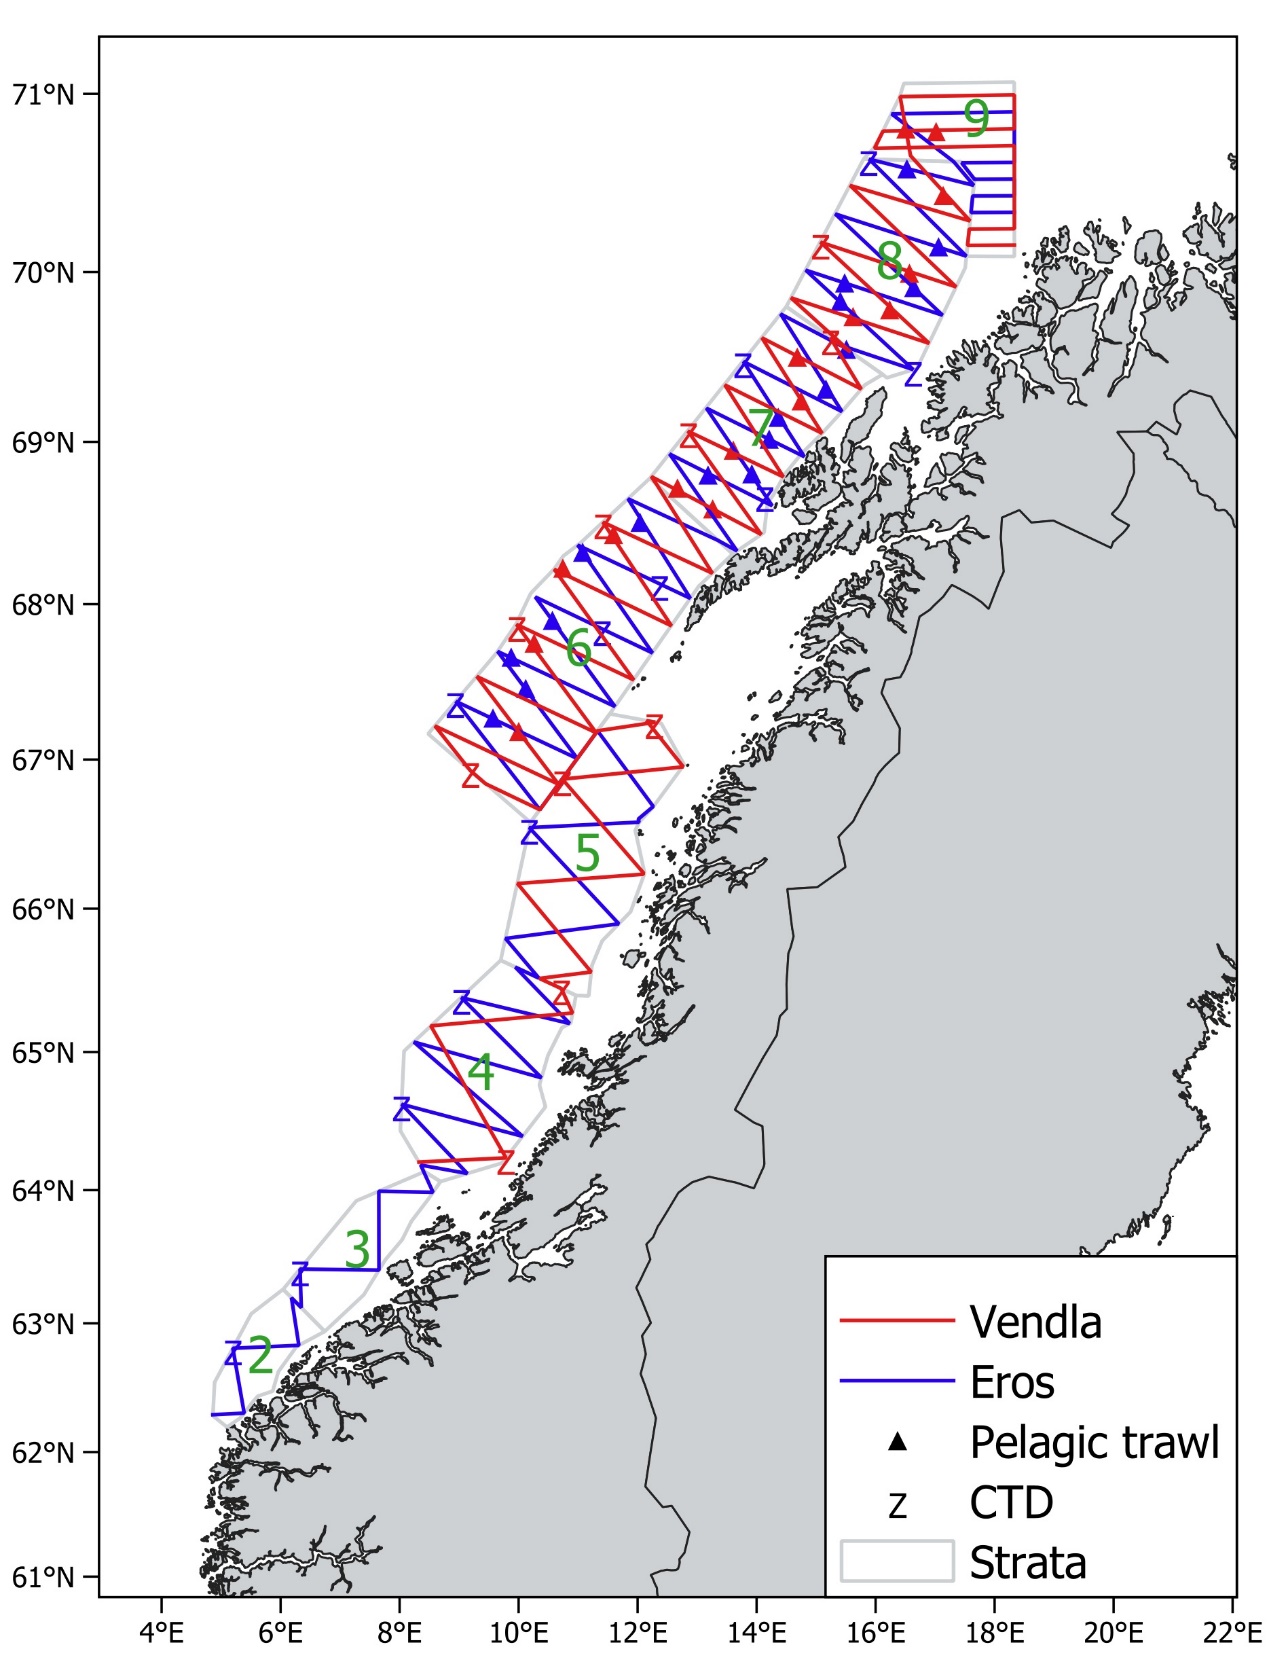
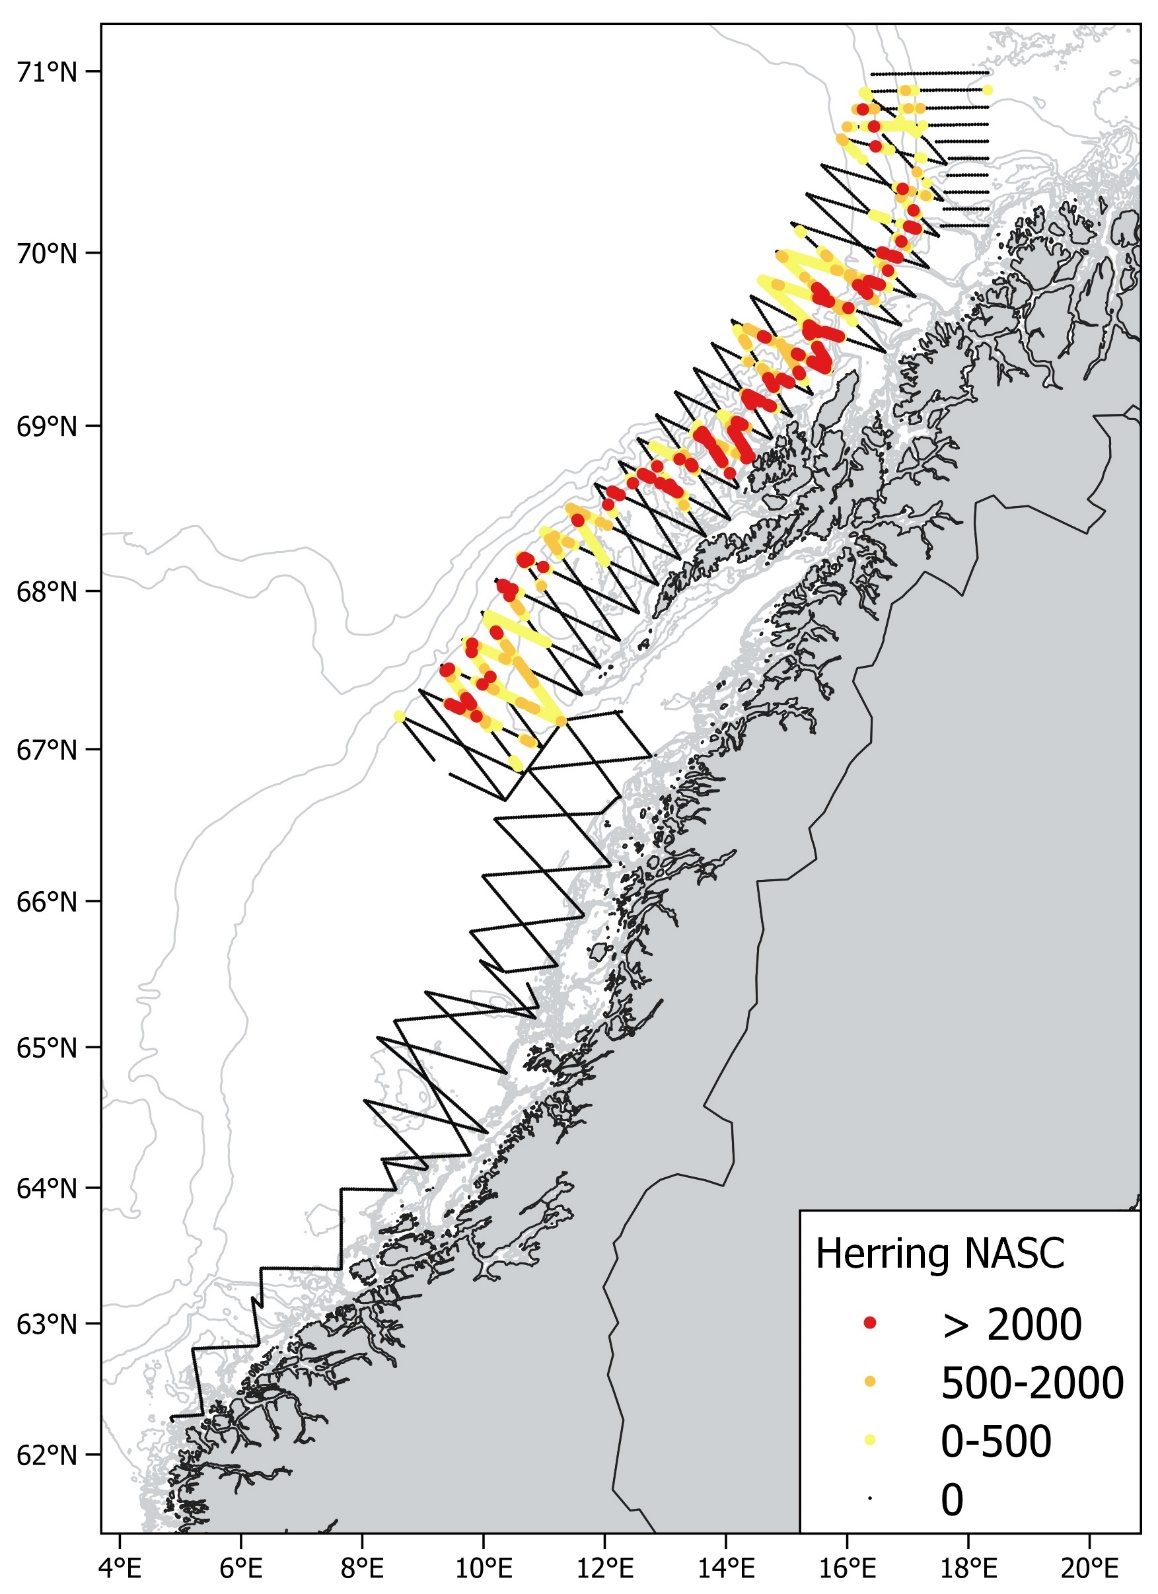
The cruise tracks of the NSSH spawning survey in 2024, together with pelagic trawl stations and CTD stations are shown in Figure 2. During the echo sounder calibration in Bergen at the start of the survey on February 13, it was discovered that Vendla’s 38 kHz transducer was defect and had to be replaced. This was successfully conducted in Måløy during February14-15, but the delay led to very low degree of coverage in Stratum 2 and 3 as only Eros covered these. However, the degree of coverage was considered good enough to establish absence of NSS herring in the area. Vendla started the survey in Stratum 4, and this and the next (Stratum 5) were surveyed with a moderate degree of coverage (around 7). The degree of coverage south of 66°N was planned to be low to moderate since we expected very low abundance in this area, which turned out to be the case. In contrast, the survey coverage in Stratum 6 and 7 (west of Lofoten and Vesterålen) was 13, which is a very heigh degree of coverage. In the two northernmost strata, Stratum 8 and 9, the degree of coverage was 11 and around 10, respectively. The weather conditions were exceptionally good during the entire survey this year so no weather-induced problems with recording of acoustic data or trawling were encountered. Pelagic trawl hauls were carried out regularly (Fig. 2) in the areas where herring like marks were observed on the echo sounder, to confirm the acoustic observations based on species composition in the catch and to obtain biological samples of individual length, weight, maturity stage and age of herring. A total of 32 pelagic trawl hauls and 22 CTD casts were carried out (Fig. 2). Nautical area scattering coefficients (NASC) allocated to herring from acoustic transects by each nautical mile are shown in Figure 3. Herring schools started to appear on the echosounders at Røsttunga, 60 nautical miles west-southwest of Røst, and herring was also caught in pelagic trawl hauls here (the two southernmost trawl hauls in Fig. 2). Herring was observed in the echograms and in trawl hauls in all strata north of this. The highest concentrations were observed in the Stratum 7 (west of Vesterålen), both around the shelf edge and on the banks nearer land. Herring was also observed in the two northernmost strata, Stratum 8 and 9, but a significant fraction of the herring here were young and immature. Some capelin schools were observed in the two northernmost strata, both on the echograms and in the pelagic trawl samples.
3.2 - Survey estimates
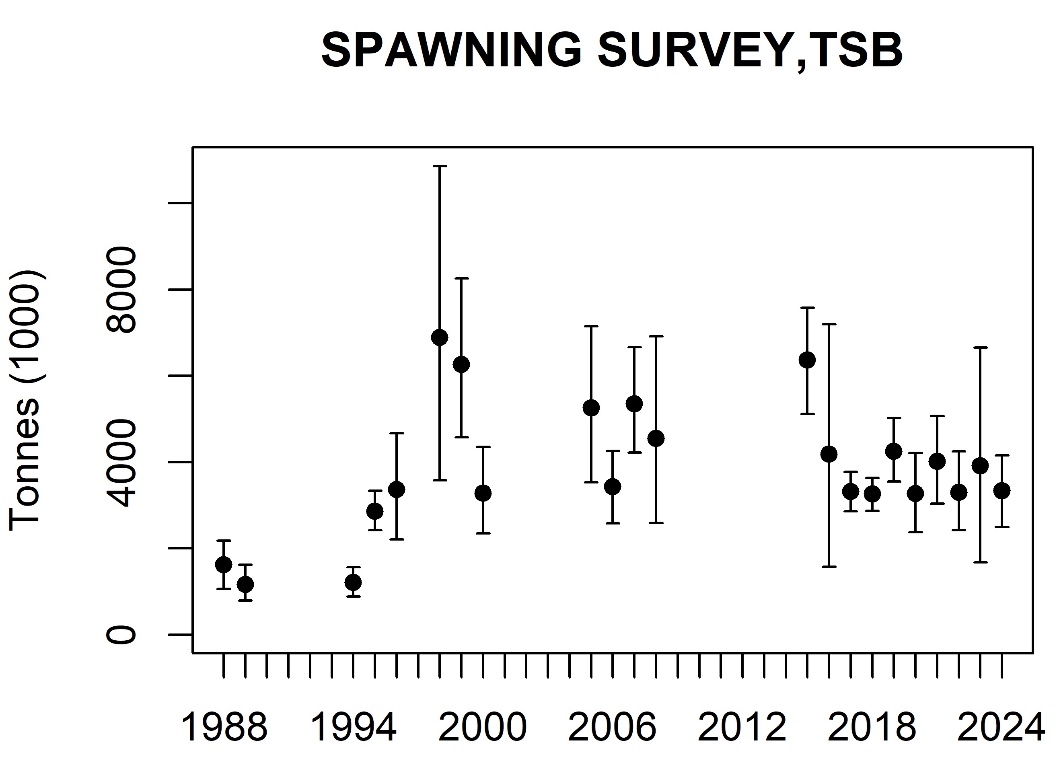
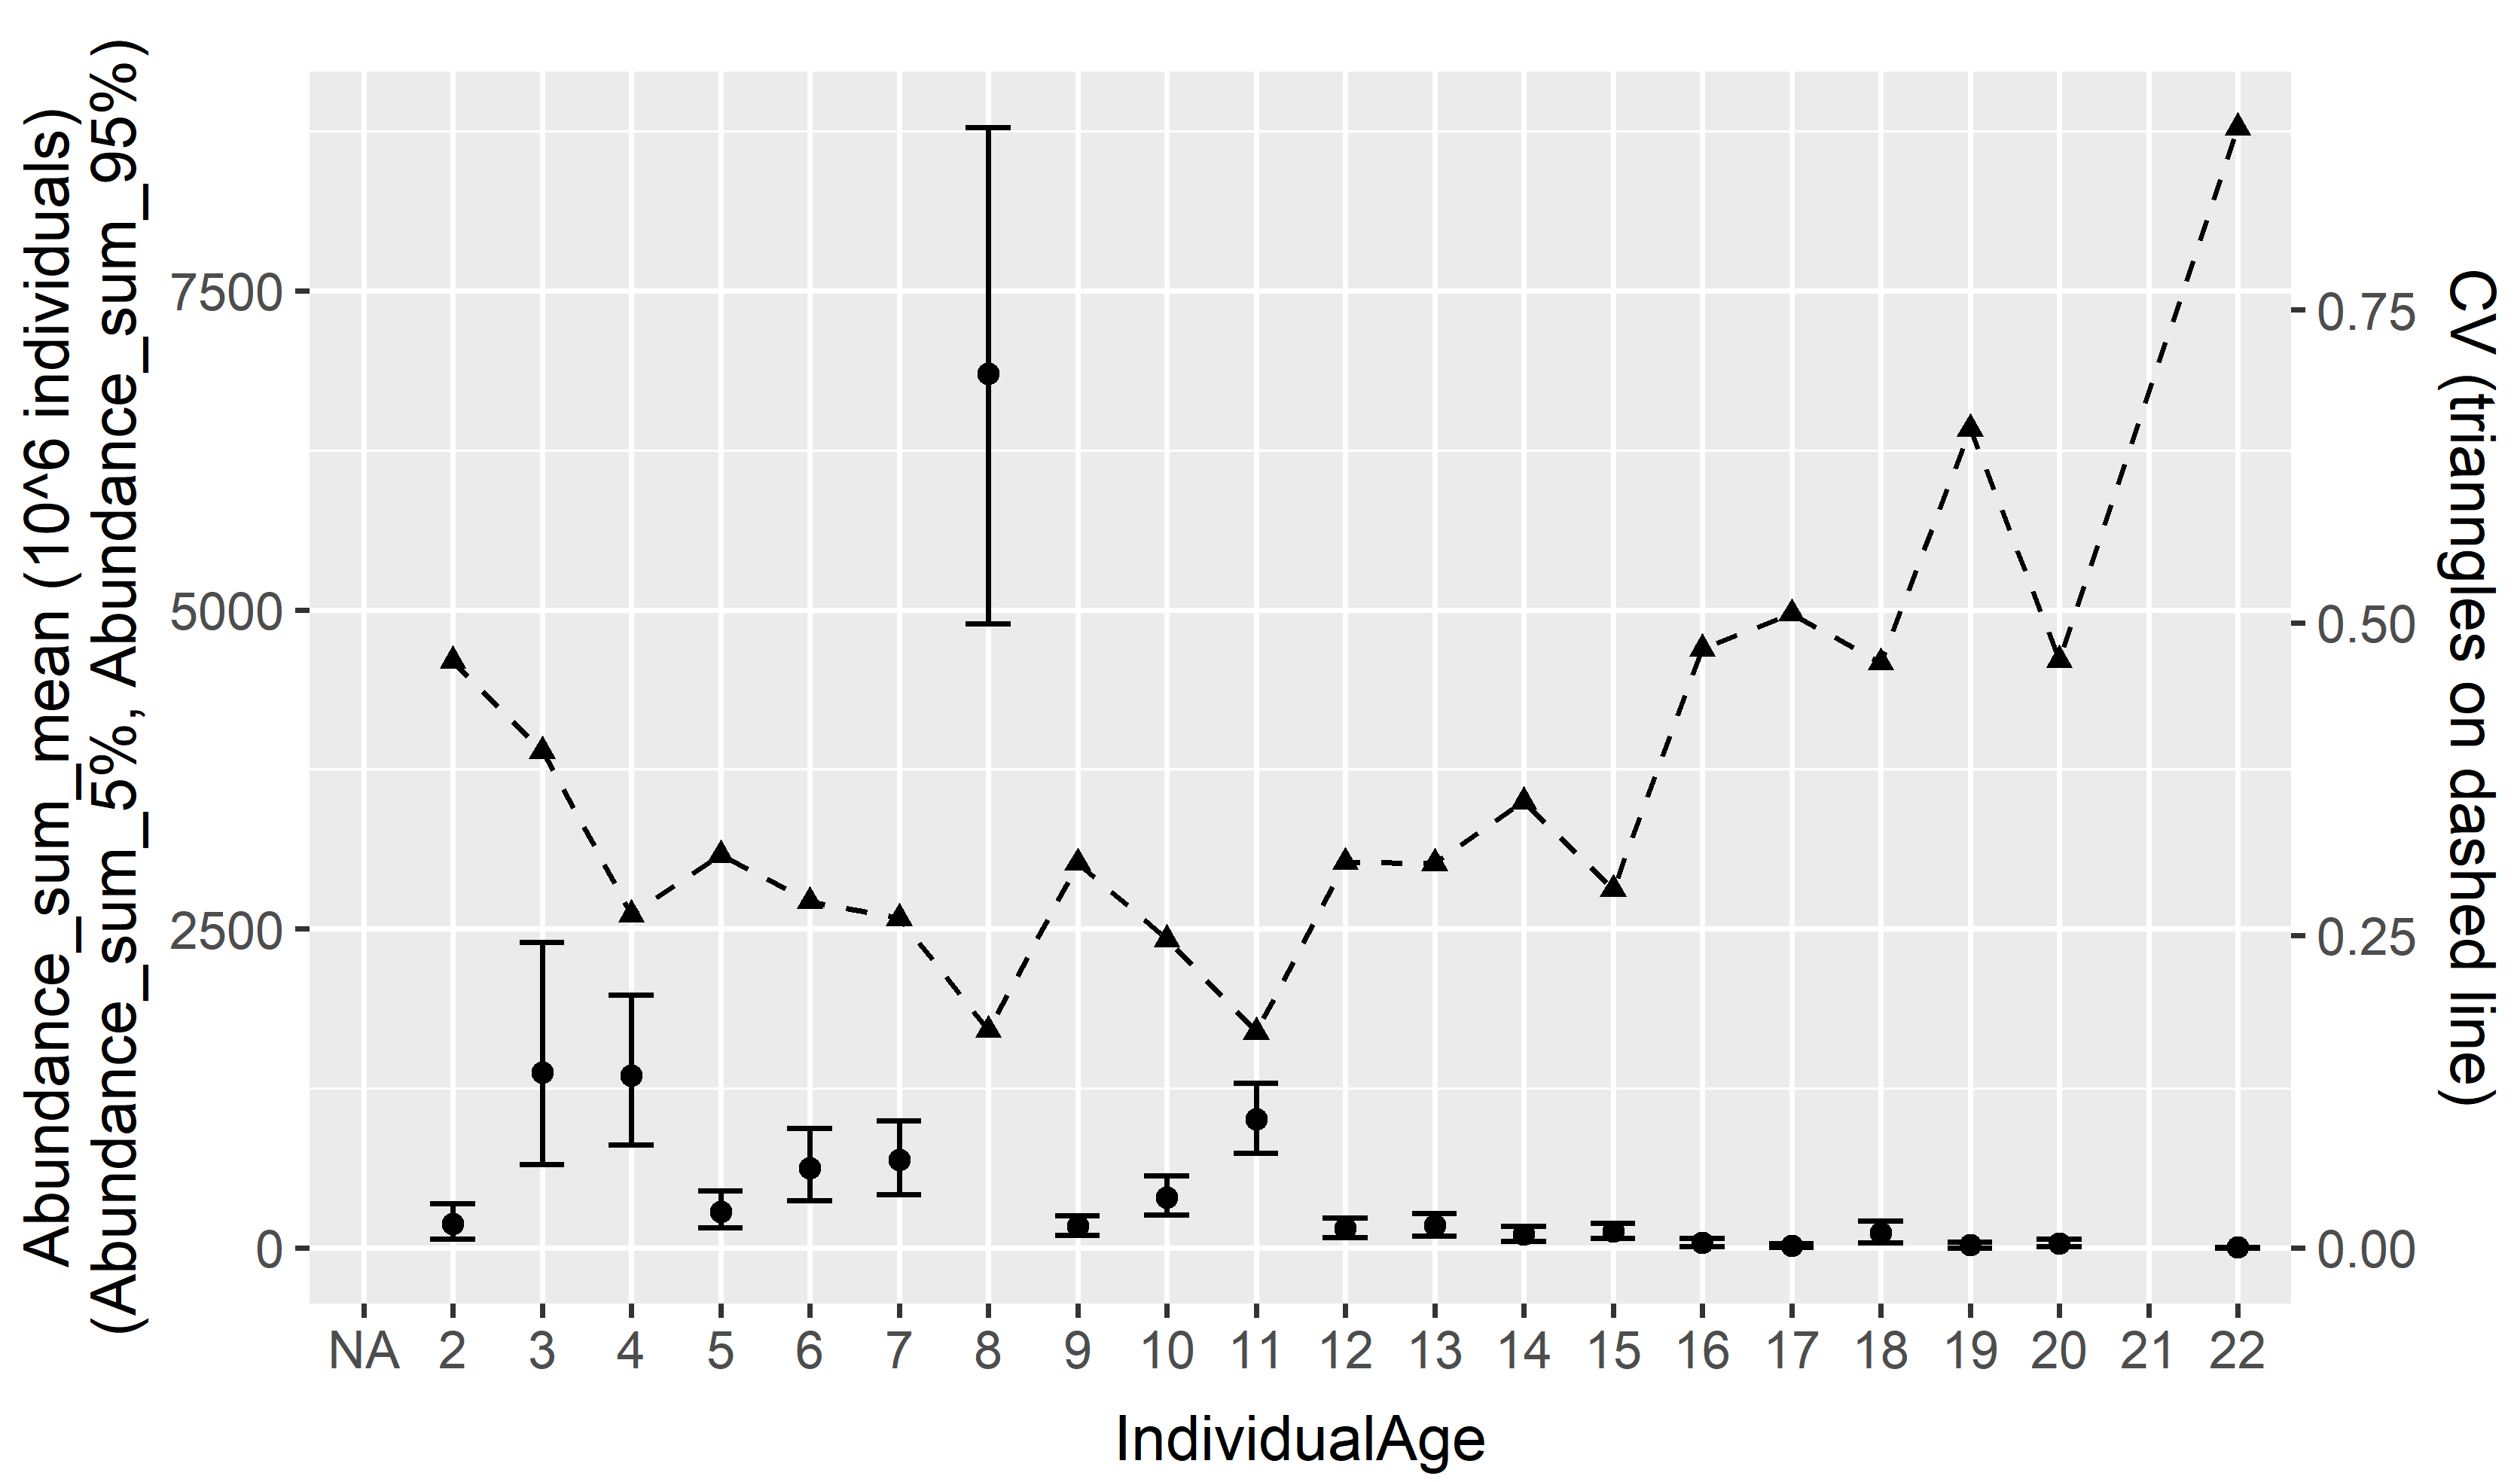
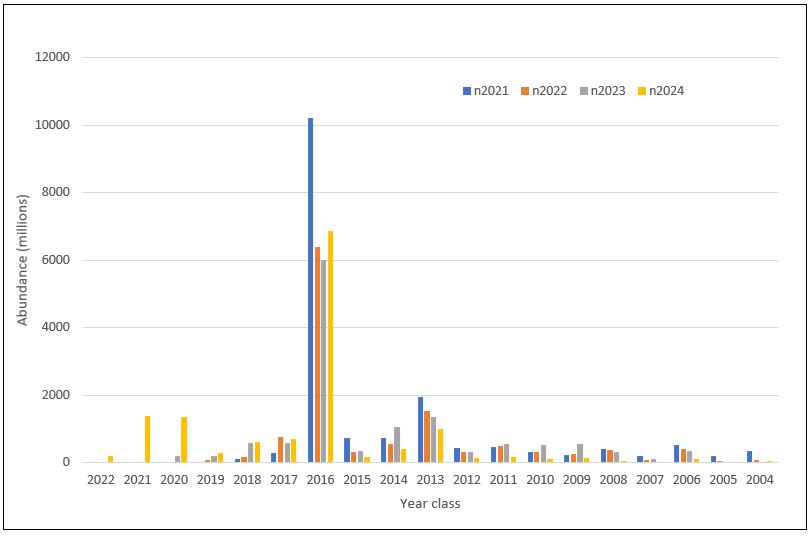
The abundance estimates from this survey are considered as relative indices of abundance in the ICES stock assessment, since there are highly uncertain scaling parameters like acoustic target strength and compensation for herring migrating. The abundance estimates are shown in Table 1 and 2. In terms of the mean estimates, the 2016 year class (age 8) dominated both in numbers (50 %) and biomass (57 %). Compared with the mean estimates from last year (see Salthaug and Stenevik 2023) the 2016 year class increased by 19 % in numbers. The mean estimate of total stock biomass (TSB) in the survey area was 3.34 million tons which is a decrease by 15 % from last year. The time series of mean of total stock biomass from the survey is shown in Figure 4. The mean estimate of total stock number (TSN) in the survey area was 13.73 billion, which is 5 % higher than last year’s estimate. The relative standard error (RSE) of TSB and TSN is 15 % (Tab. 1 and 2), which is much lower than the RSEs from last year (39-40%). The RSE per age group (Tab.1, Tab. 2 and Fig. 5) shows a high uncertainty for the very young and old ages and lower uncertainty for the most abundant age groups in the survey (e.g. 17 % for the 2016 year class). Figure 6 shows estimates of abundance per year class in the four most recent surveys. These numbers are expected to decline between consecutive years due to mortality, for ages that are fully recruited to the survey (seems to be age 5 or 6). Such declines are observed for the year classes older than 2016, however, as mentioned above, the 2016 year class shows an increase from 2023 and also from 2022. However, such “unexpected” observations may be explained by the high sampling variance experienced. The 2020 and 2021 year classes are stronger than what is normal for ages 3 and 4 in this survey time series, which is a positive sign for the future. Mean weight and length from the 2024 spawning survey are shown in Table 3. The mean estimates are slightly lower than last year.
3.3 - Spatial distribution of the stock and maturity
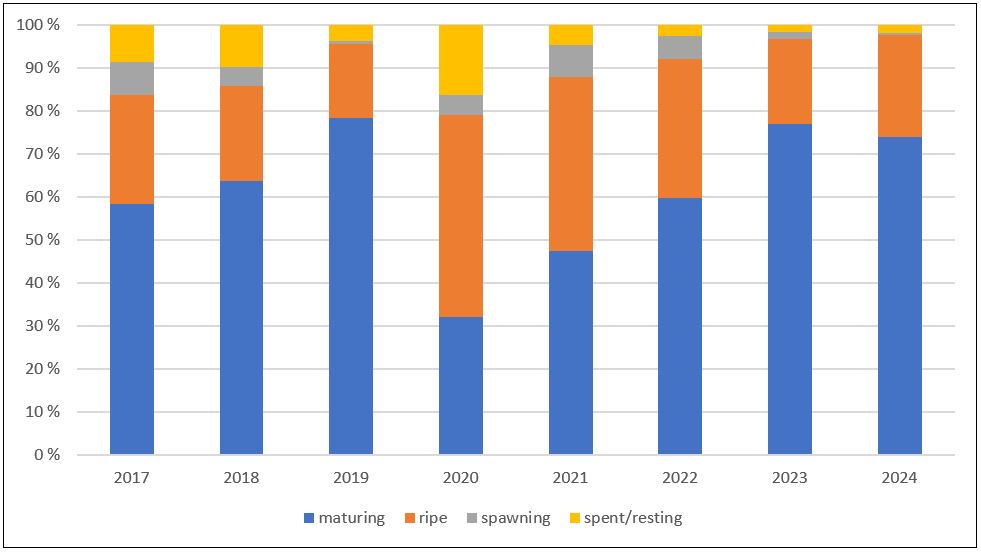
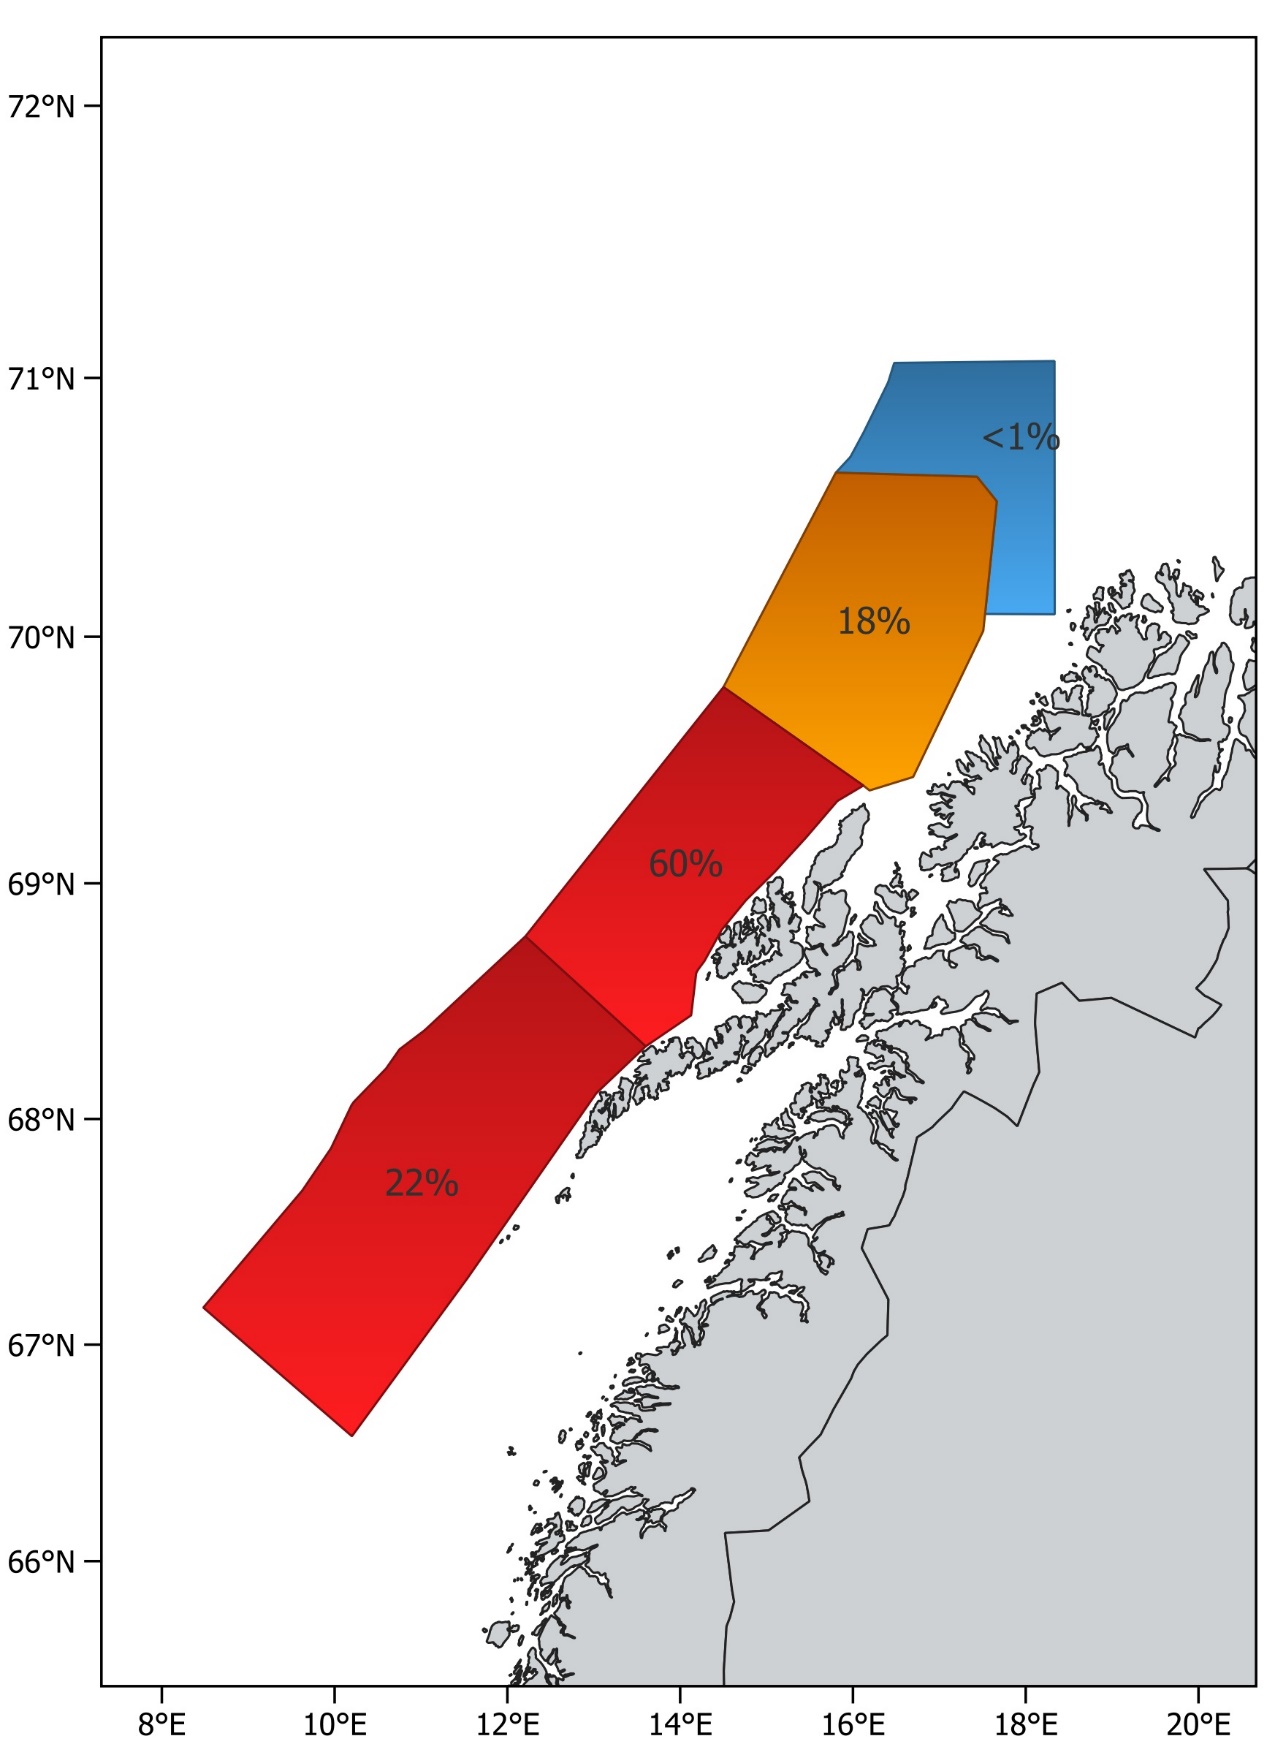
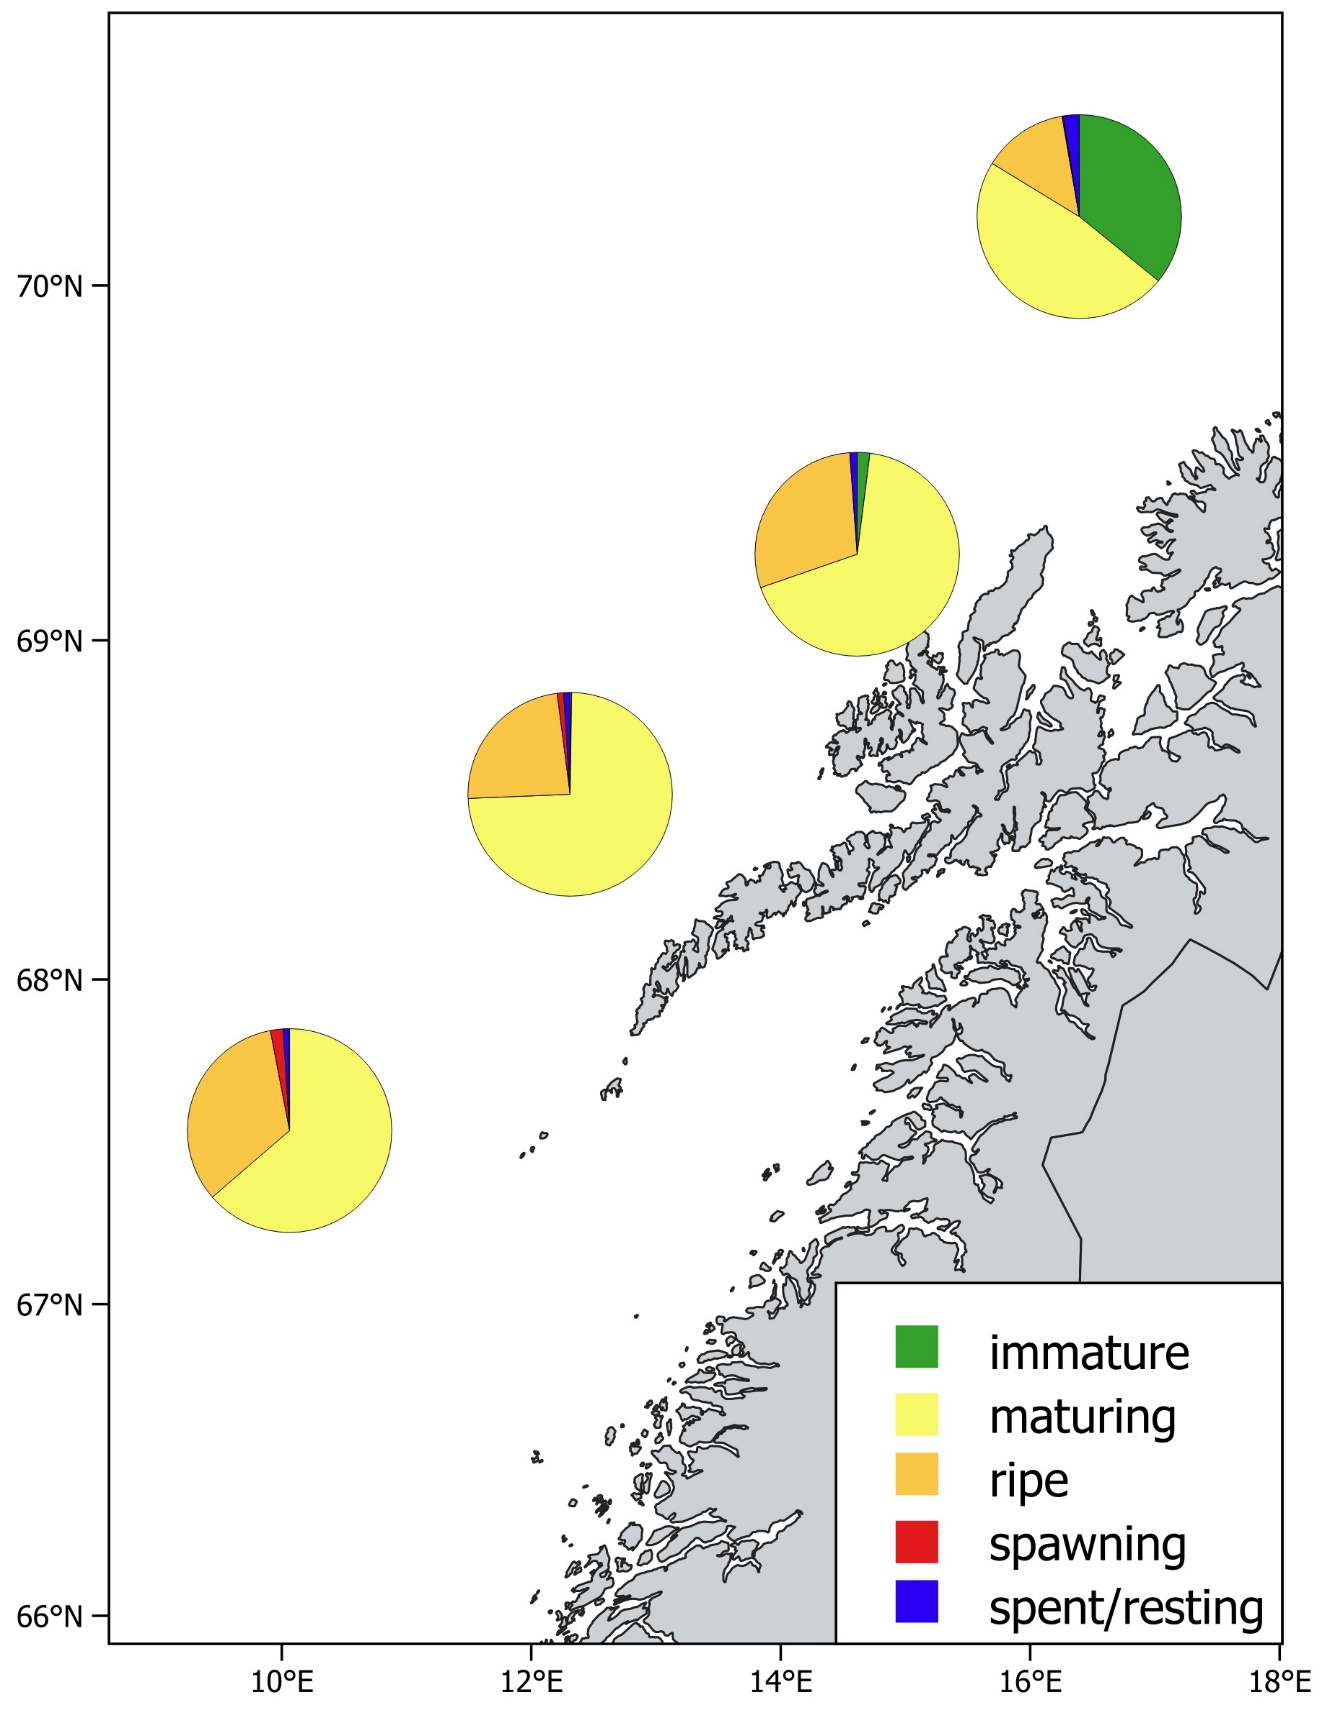
The relative distribution of the estimated biomass per stratum is shown in Figure 7. Most of the biomass (82 %) was found in Stratum 6 and 7 (west of Lofoten and Vesterålen), and a significant proportion (18 %) was found in Stratum 8 (north of Andenes). Stratum 7, west of Vesterålen, contained 60 % of the biomass which shows that the spawning stock was even more northerly distributed this year than in the most recent years. Figure 8 shows the proportion of different maturation stages at different latitudes. Most of the herring was classified as maturing or ripe. The proportion of ripe and spawning herring was highest in the southernmost area and lowest in the northernmost area. In addition, 36 % of the herring in the northernmost area was immature, reflecting the possibly abundant year classes that are now recruiting to the adult part of the stock. Regarding spawning area, the fishery indicates that most of the spawning occurred west of Lofoten and Vesterålen this year. The fishery in 2024 south of 67°N has been insignificant and based on this it is likely that the spatial distribution of the herring observed during the spawning survey reflects the spawning area. The proportion of the different spawning stages among mature herring is shown for the period 2017-2024 in Figure 9 (the surveys have been carried out in the second part of February during all these years). The proportion of maturing herring in 2024 is in the higher end of the time series together with 2019 and 2023 and this indicates that the spawning is relatively late this year.
3.4 - Geographical variation in temperatures experienced by the herring
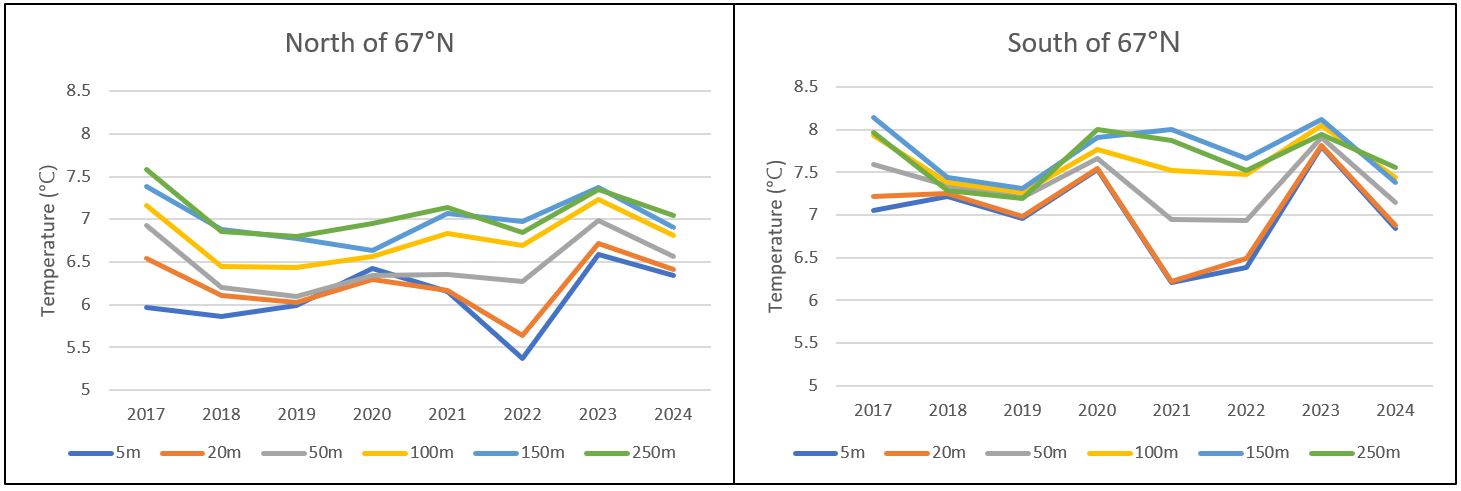
Temperatures experienced by herring from close to the surface and down to 250 m are shown in Figure 10 for the areas south and north of 67°N, for the years after 2016 when the survey has been carried out in the same period (latter half of February). The temperatures in 2024 varied from 7.6°C at 250 m depth south of 67°N to 6.3°C at 5 m depth north of 67°N. The variation in temperature in different depths is similar to last year and quite normal compared to the other years from 2017 onwards. At typical spawning depths of herring at 100-200 m depth, the temperature conditions were quite similar to those observed during the most recent NSSH spawning surveys.
3.5 - Quality of the survey
In 2024 both vessels were equipped with multifrequency echo sounders on a drop keel. The weather conditions were exceptionally good this year so acoustic data with good quality was recorded and trawling on registrations could be carried out adequately all the time. To conclude, the acoustic and biological data recorded in 2024 on the NSSH spawning survey were of satisfactory quality and the estimates from the survey are recommended to be used in the stock assessment of Norwegian spring-spawning herring in 2024.
4 - References
Aglen, A. 1989. Empirical results on precision effort relationships for acoustic surveys. Int. Coun. Explor. Sea CM 1989 B:30, 28pp.
Foote, K. 1987. Fish target strengths for use in echo integrator surveys. J. Acoust. Soc. Am. 82: 981-987.
Harbitz, A. 2019.A zigzag survey design for continuous transect sampling with guaranteed equal coverage probability. Fisheries Research 213, 151-159.
ICES. 2016. Report of the Benchmark Workshop on Pelagic Stocks (WKPELA), 29 February–4 March 2016, ICES Headquarters, Copenhagen, Denmark. ICES CM 2016/ACOM:34.
Johnsen, E., Totland, A., Skålevik, Å., Holmin, A.J., Dingsør, G.E., Fuglebakk, E., Handegard, N.O. 2019. StoX: An open source software for marine survey analyses. Methods in Ecology and Evolution 10:1523–1528.
Jolly, G.M., and Hampton, I. 1990. A stratified random transect design for acoustic surveys of fish stocks. Canadian Journal of Fisheries and Aquatic Sciences 47: 1282-1291.
Korneliussen, R. J., Heggelund, Y., Macaulay, G. J., Patel, D., Johnsen, E., and Eliassen, I. K. 2016. Acoustic identification of marine species using a feature library. Methods in Oceanography, 17: 187–205.
MacLennan, D.N., Fernandes, P., and Dalen, J. 2002. A consistent approach to definitions and symbols in fisheries acoustics. ICES J. Mar. Sci., 59: 365-369.
Simmonds, J, and David N. MacLennan. 2005. Fisheries acoustics: theory and practice. John Wiley & Sons, 2008.
Salthaug, A., Stenevik, E.K., Vatnehol, S., Anthonypillai, V., and Slotte, A. 2021. Distribution and abundance of Norwegian spring spawning herring during the spawning season in 2021. Survey report / Institute of Marine Research/ISSN 15036294/Nr. 1– 2021.
Salthaug, A. and Stenevik, E.K. 2023. Distribution and abundance of Norwegian spring spawning herring during the spawning season in 2023. Survey report / Institute of Marine Research/ISSN 1893-4536/No. 21– 2023.
5 - Tables
| Age | 5th percentile | 95th percentile | Mean | SD | RSE |
|---|---|---|---|---|---|
| 2 | 68 | 345 | 189 | 89 | 0.47 |
| 3 | 653 | 2396 | 1376 | 546 | 0.40 |
| 4 | 809 | 1980 | 1348 | 359 | 0.27 |
| 5 | 158 | 445 | 285 | 89 | 0.31 |
| 6 | 372 | 940 | 622 | 172 | 0.28 |
| 7 | 416 | 999 | 688 | 181 | 0.26 |
| 8 | 4893 | 8780 | 6852 | 1193 | 0.17 |
| 9 | 99 | 253 | 170 | 52 | 0.31 |
| 10 | 260 | 563 | 395 | 97 | 0.25 |
| 11 | 743 | 1293 | 1005 | 174 | 0.17 |
| 12 | 82 | 236 | 150 | 46 | 0.31 |
| 13 | 96 | 273 | 177 | 54 | 0.31 |
| 14 | 53 | 173 | 107 | 38 | 0.36 |
| 15 | 74 | 193 | 129 | 37 | 0.29 |
| 16 | 13 | 73 | 39 | 19 | 0.48 |
| 17 | 4 | 34 | 18 | 9 | 0.51 |
| 18 | 39 | 213 | 114 | 53 | 0.47 |
| 19 | 0 | 44 | 21 | 14 | 0.66 |
| 20 | 9 | 67 | 37 | 17 | 0.47 |
| 22 | 0 | 5 | 2 | 2 | 0.90 |
| TSN | 10343 | 17236 | 13733 | 2116 | 0.15 |
| Age | 5th percentile | 95th percentile | Mean | SD | RSE |
|---|---|---|---|---|---|
| 2 | 3 | 16 | 9 | 4 | 0.46 |
| 3 | 42 | 148 | 88 | 33 | 0.38 |
| 4 | 113 | 271 | 187 | 48 | 0.26 |
| 5 | 29 | 73 | 49 | 14 | 0.28 |
| 6 | 85 | 214 | 142 | 39 | 0.27 |
| 7 | 108 | 258 | 178 | 47 | 0.26 |
| 8 | 1348 | 2430 | 1890 | 328 | 0.17 |
| 9 | 30 | 76 | 51 | 15 | 0.30 |
| 10 | 84 | 177 | 126 | 30 | 0.24 |
| 11 | 242 | 424 | 329 | 56 | 0.17 |
| 12 | 28 | 79 | 51 | 15 | 0.30 |
| 13 | 34 | 92 | 61 | 18 | 0.29 |
| 14 | 20 | 62 | 39 | 13 | 0.34 |
| 15 | 28 | 72 | 48 | 14 | 0.28 |
| 16 | 5 | 28 | 15 | 7 | 0.47 |
| 17 | 1 | 13 | 7 | 4 | 0.51 |
| 18 | 15 | 77 | 42 | 18 | 0.44 |
| 19 | 0 | 17 | 8 | 5 | 0.66 |
| 20 | 4 | 27 | 15 | 7 | 0.47 |
| 22 | 0 | 2 | 1 | 1 | 0.90 |
| TSB | 2497 | 4153 | 3337 | 506 | 0.15 |
| Age | mean weight (g) | RSE(weight) | mean length (cm) | RSE(length) |
|---|---|---|---|---|
| 2 | 43.3 | 0.039 | 19.4 | 0.011 |
| 3 | 61.6 | 0.038 | 21.5 | 0.010 |
| 4 | 135.8 | 0.030 | 27.0 | 0.008 |
| 5 | 186.1 | 0.071 | 29.4 | 0.021 |
| 6 | 230.0 | 0.023 | 31.2 | 0.006 |
| 7 | 257.8 | 0.016 | 32.4 | 0.005 |
| 8 | 278.3 | 0.005 | 33.2 | 0.002 |
| 9 | 303.4 | 0.018 | 34.3 | 0.006 |
| 10 | 329.0 | 0.019 | 35.2 | 0.006 |
| 11 | 334.8 | 0.011 | 35.3 | 0.004 |
| 12 | 351.4 | 0.020 | 36.0 | 0.006 |
| 13 | 355.0 | 0.025 | 36.0 | 0.007 |
| 14 | 376.3 | 0.030 | 36.8 | 0.010 |
| 15 | 373.8 | 0.017 | 36.9 | 0.004 |
| 16 | 387.3 | 0.045 | 37.2 | 0.014 |
| 17 | 390.6 | 0.041 | 37.7 | 0.008 |
| 18 | 377.8 | 0.050 | 36.8 | 0.013 |
| 19 | 394.7 | 0.078 | 37.7 | 0.011 |
| 20 | 399.3 | 0.041 | 37.9 | 0.012 |
| 22 | 466 | 40 |
6 - Figures
7